10 open-source Kubernetes tools for highly effective SRE and Ops Teams
- Abhishek Tiwari
- Technology
- 10.59350/wf01f-emx26
- Crossref
- January 6, 2018
Table of Contents
If you are running workloads in Kubernetes, your site reliability engineering (SRE) and operations (Ops) teams need right kind of tooling to ensure the high-reliability of the Kubernetes cluster and workloads running in it. Here we present a list of 10 open-source Kubernetes tools to make your SRE and Ops teams more effective to achieve their service level objectives.
Kube-ops-view
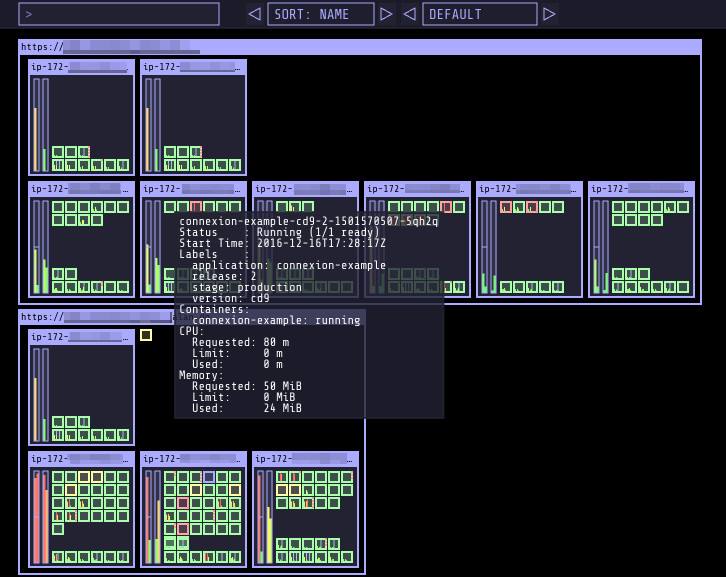
Kube-ops-view provides a common operational view for multiple Kubernetes clusters. It is a handy tool for SRE and Ops teams. Kube-ops-view provides read-only system dashboard. Some of the cool features offered by kube-ops-view,
- Switch between multiple Kubernetes clusters
- Render nodes and indicate their overall status (“Ready”)
- Show node capacity and resource usage (CPU, memory)
- Indicate status of pods (green: ready/running, red: error etc)
- Provide tooltip information for nodes and pods
- Animate pod creation and termination
- Project dashboards on TV screens using screen tokens
Cabin
Cabin is the native mobile dashboard app for Kubernetes. Cabin UI is built using React Native hence runs both iOS and Android devices. It is an on the move assistant which provides fine-grained actions to manipulate Kubernetes resources. Cabin app is touch optimised. So for instance, you can delete pods with a single left swipe. You can scale deployments with a finger scroll.
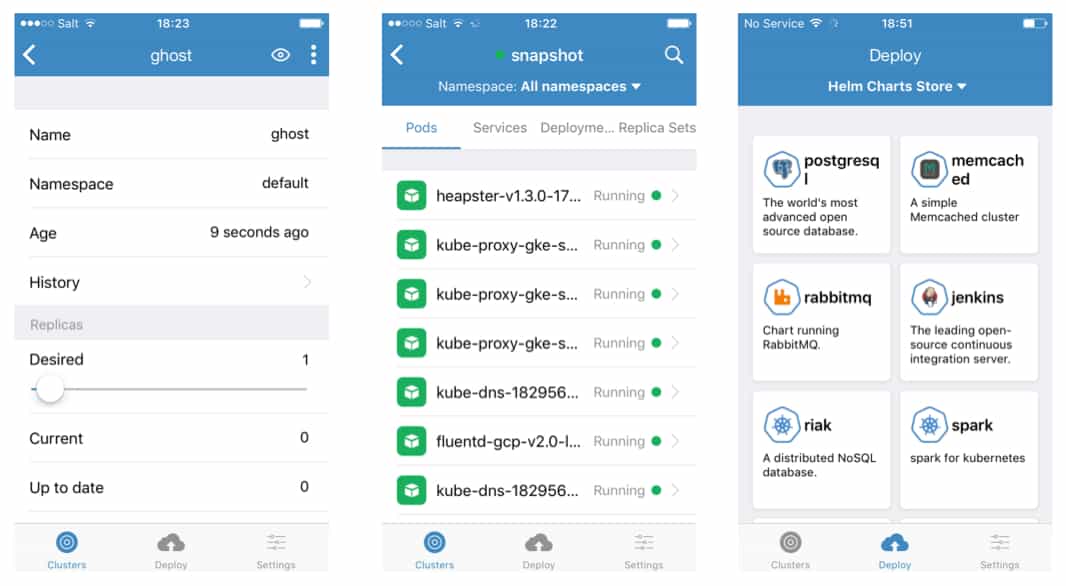
Some of the interesting features included in Cabin,
- Seamless support for Google Kubernetes Engine (GKE). You can create GKE clusters directly from your mobile phone.
- Early support for Help charts, you can view Charts repositories and launch charts with one click on the move.
- Access pod logs, search resources by the label, trigger rolling-updates by changing the image of your deployments etc.
Kubectx
Kubectx is another must-have tool if you working with multiple Kubernetes clusters. Kubectx comes bundled with kubens and together they allow you switch between Kubernetes clusters and namespaces when using kubectl.

kubectx and kubens support tab completion on bash/zsh shells to help you with long context names. You don’t have to remember full context names anymore.
Kube-shell
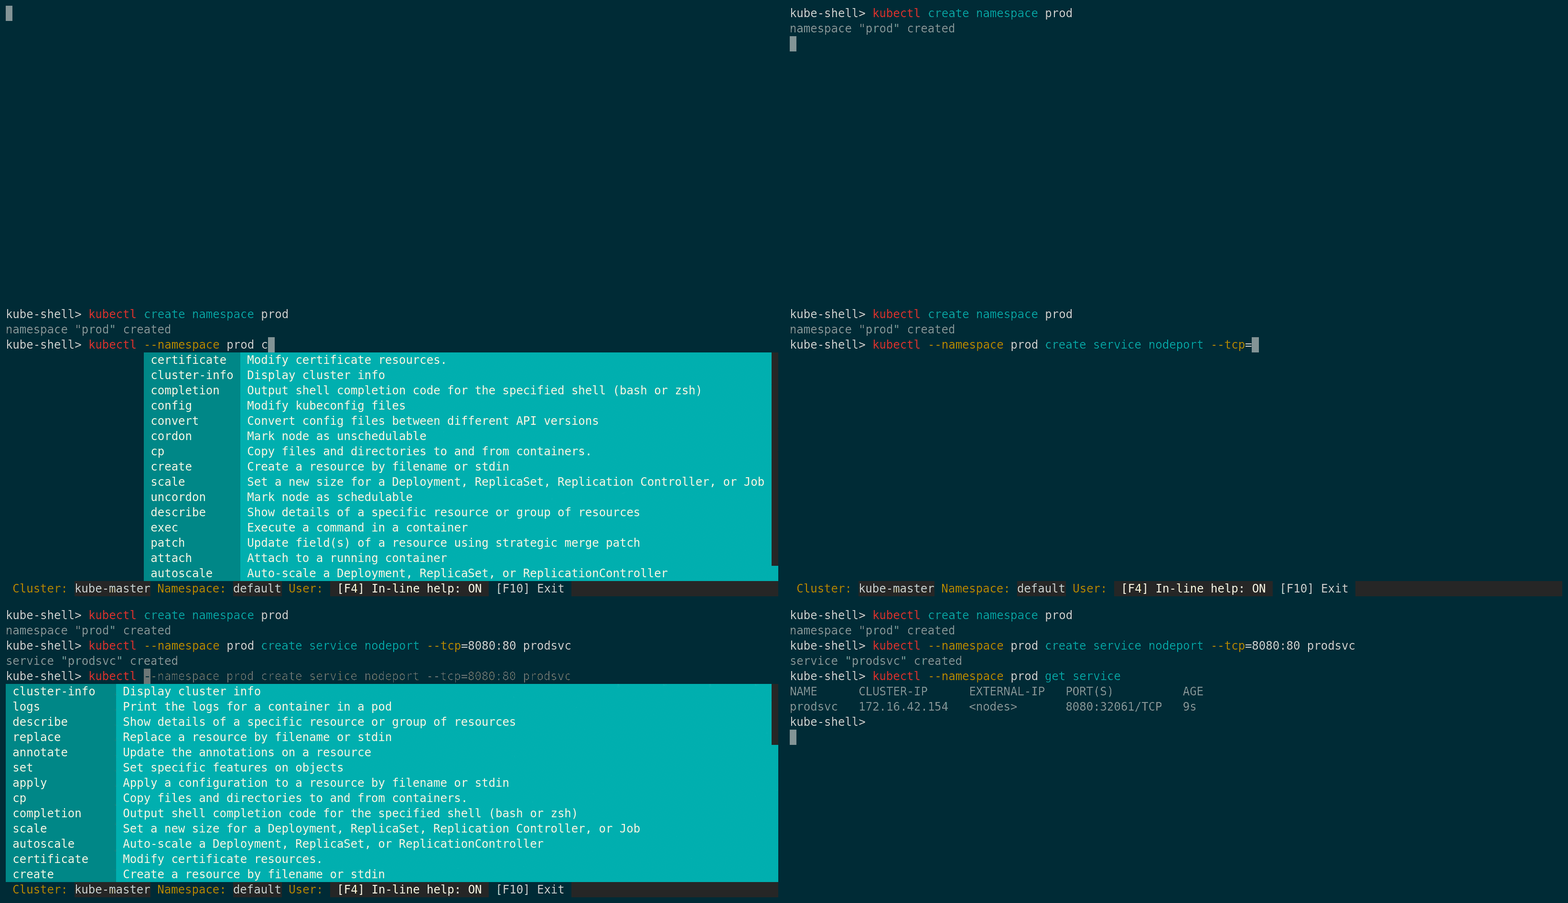
Kube-shell is an integrated shell for working with the Kubernetes CLI. It has some really nifty features such as
- auto-completion of commands, auto-suggestions, in-line documentation
- access to the history of commands executed by using up/down arrow keys
- current context from kubeconfig, easy switch between the clusters/namespaces
Related tools
Kube-prompt is yet another interactive Kubernetes client featuring auto-complete. It accepts commands without kubectl prefix.
In addition, Kube-ps1 is a neat script that lets you add the current Kubernetes context and namespace configured on kubectl to your Bash/Zsh prompt strings.
Lastly, Kail is Kubernetes tail. As a Kubernetes log viewer, kail allows you to stream logs from matching pods using selectors.
You can match pods based on a standard label selector, by name, by service, by deployment, etc.
Update:
Stern is another log tailing solution focused pods and containers within the pod. With Stern, the result is color-coded for quicker debugging.
Telepresence
Telepresence is an open source tool that lets you debug a service locally while keeping the connection with its dependency services hosted in a remote Kubernetes cluster and remote cloud resources like a database.

Personally, I think Telepresence has a lot potential. Telepresence is already a powerful local development environment for services running in Kubernetes. Live debugging part is new but evolving quite rapidly.
Weave Scope
Weave Scope is troubleshooting & monitoring tool for Docker and Kubernetes. It automatically builds logical topologies of your application and infrastructure which enable your SRE and Ops team to intuitively understand, monitor, and control your containerized, microservices based application.
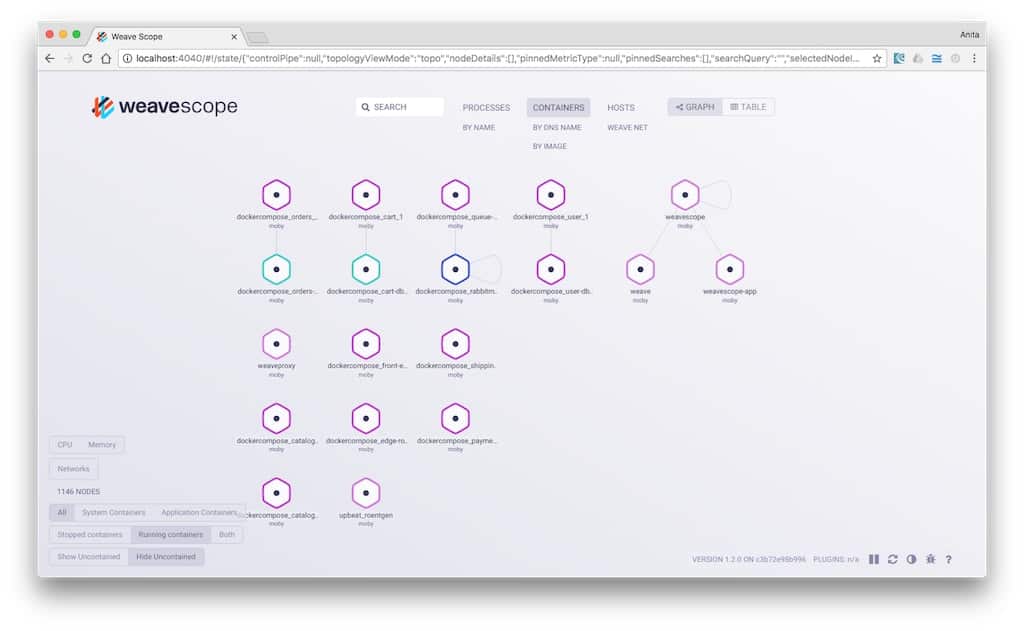
Apart from Topology view, Weave Scope can provide a drill down views i.e everything between nodes and processes including deployments, services, replica sets, pods, and containers. In addition, you can apply filters based on CPU and Memory usage or use search to quickly find node types, containers, and processes by name, label or even path.
PowerfulSeal
PowerfulSeal is inspired by Chaos Monkey and developed by Bloomberg engineering team. It can add chaos to your Kubernetes clusters like killing targeted pods and nodes. It operates in two modes: interactive and autonomous.
Interactive mode is designed to allow you to discover your cluster’s components, and manually break things to see what happens. It operates on nodes, pods, deployments, and namespaces.
Autonomous mode reads a policy file, which can contain any number of pod and node scenarios. Each scenario describes a list of matches, filters, and actions to execute on your cluster.
Policy files are written in YAML format and includes scenarios which will be executed by the autonomous agent.
Related tools
kube-monkey is an alternative implementation of Netflix’s Chaos Monkey for Kubernetes clusters. It randomly deletes pods in the Kubernetes cluster encouraging and validating the development of failure-resilient services.
Marmot
Marmot is a workflow execution engine from Google for processing workflows targeting DevOps/SRE needs. It has been designed as a tool for handling infrastructure changes but it can be used with Kubernetes.
It is particularly suitable for any type of operation that must be performed in steps with certain pacing and may require state checks for health. So, for instance, you are rolling out a new service version on Kubernetes with a large number of instances then you perform an incremental but controlled rollout (canary release).
Ark
Ark is a tool for managing disaster recovery for your Kubernetes resources and volumes. Ark provides a simple and operationally robust way to back up and restore Kubernetes resources and Persistent Volumes from a series of checkpoints. The backup files are stored in an object storage service (e.g. Amazon S3).
Ark enables you to you to automate following scenarios in a more efficient way,
- Disaster recovery with reduced TTR (time to respond)
- Cross-cloud-provider migration of Kubernetes API objects
- Dev and testing environment setup (+ CI), via replication of prod
Ark comes with an in-cluster service (Ark server) and CLI (Ark client). In-cluster service does the most of heavy lifting as it runs all of the Ark controllers. Ark server performs the actual backup, validates it and loads backup files in cloud object storage.
Sysdig
Sysdig is container troubleshooting tool which captures system calls and events from the Linux kernel. Simply put, Sysdig is strace + tcpdump + htop + iftop + lsof + wireshark for your entire cluster.
Sysdig instruments your physical and virtual machines at the OS level by installing into the Linux kernel and capturing system calls and other OS events. Sysdig also makes it possible to create trace files for system activity
Related tools
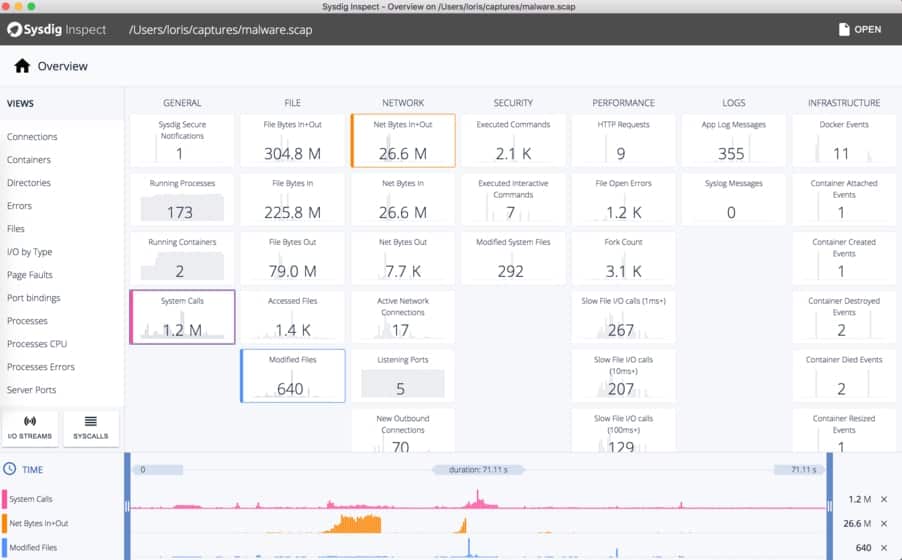
Sysdig Inspect is an interface to visualize the data collected by Sysdig. Sysdig Inspect enables SRE and Ops teams in container troubleshooting and security investigation.
Inspect’s user interface is designed to intuitively navigate the data-dense Sysdig captures that contain granular system, network, and application activity of a Linux system. Sysdig Inspect helps you understand trends, correlate metrics and find the needle in the haystack. It comes packed with features designed to support both performance and security investigations, with deep container introspection.
Sysdig Falco is another tool built on top of granular data collected by Sysdig. Falco monitors behavioral activity and it is designed to detect anomalous activity in your application. For instance, using Falco you can detect activities such as,
- a shell is run inside a container
- a container is running in privileged mode
- a container is mounting a sensitive from the host
Final thoughts
Kubernetes ecosystem is observing an explosive growth. There are a large number of open source and commercial tools which you can help you to be more effective and efficient when operating missing-critical Kubernetes cluster and services. As always, setting down on top 10 tools is not easy. Did we miss something? Tell us on Twitter if you are using something interesting to manage Kubernetes in production.
10 open-source tools for highly effective Kubernetes SRE and Ops Teams https://t.co/XUaYr3qfzb #Kubernetes #SRE #Devops #ops
— Abhishek Tiwari (@abhishektiwari) January 6, 2018
Tell us what is your favorite SRE/ops tool to run Kubernetes in production.


