Circular/Radial Visualizations in Bioinformatics
- Abhishek Tiwari
- Research
- 10.59350/3jj02-c2364
- Crossref
- February 8, 2009
Table of Contents
Information visualization is in the core of bioinformatics, and over the time variety of interesting information visualization approaches have been developed to visualize the different type of biological information. This post is specifically targeted on circular/radial visualization in biological domain.
Circular visualization techniques provide better utilization of the available space to represent information in an aesthetic and comprehensive manner. Circular/radial visualizations are highly regularized with stress on compact and focused presentation. There are 4 basic classes of circular/radial visualization techniques,
Polar Plot
- Tree (Visual Thesaurus, Sociograms, MoireGraphs, Hyperbolic Browser)
- Star (Starstruck, Neighbourhood Explorer, Sparkler, Star Coordinates)
Radial Space Filling
- Concentric (Fan chart, PieTree, Polar TreeMaps, Information Slices, Sunburst, InterRing)
- Spiral (RankSpiral, SpiralView)
- Euler (Zoomology, MoireTrees, PhylloTrees, Bubbleworld)
Ring
- Connected (Daisy Analyzer, VisAlert)
- Disconnected (Event Tunnel, SQiRL)
Spoked
For a comparison of the different circular/radial visualizations techniques please refer publications by Hanna et al and Draper et al.. However, this basic classification alone is not sufficient to capture the high order of variation among different radial visual representations. By combining the ideas of these basic visualization techniques we can create advanced hybrid patterns.
Now onwards I will be describing variety of circular/radial visualization patterns in bioinformatics domain.
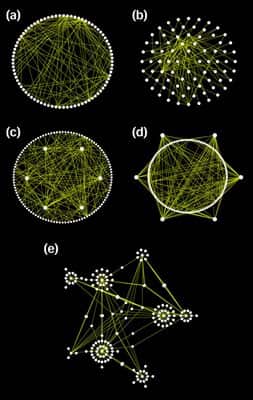
Osprey
Osprey is a network visualization system. Osprey facilitate visualization and manipulation of complex interaction networks in large-scale datasets. Osprey also provides several default network layouts options to avoid cluttered and clumpy representations. Layout options included in Osprey are: (a) Circular ; (b) concentric circle with five rings; (c) dual ring with highly connected nodes on the inside; (d) dual ring with highly connected nodes outside; (e) spoked dual ring; (f) default spoke.
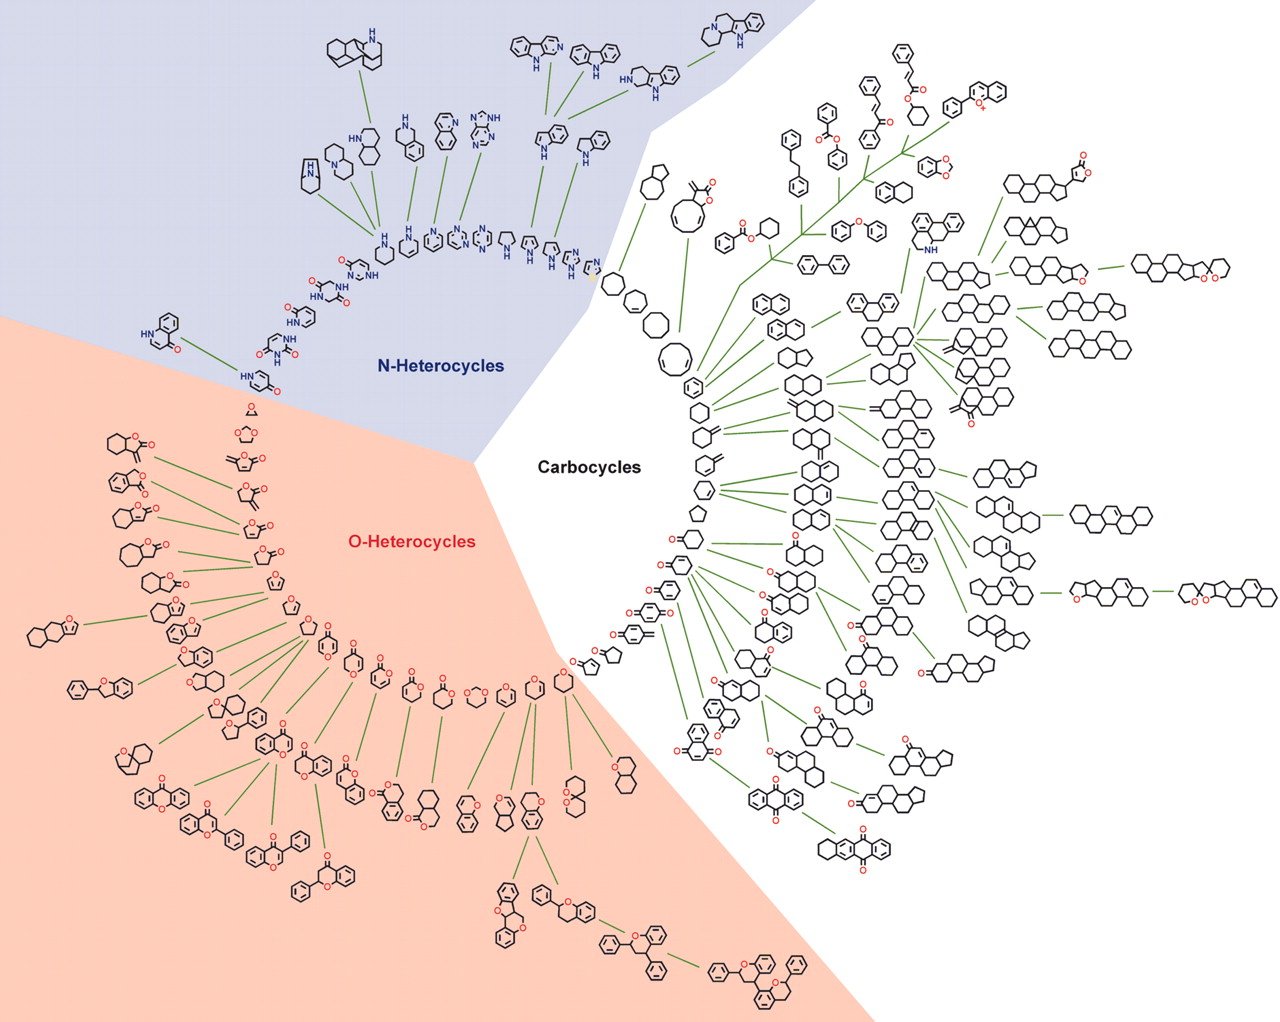
SCONP
SCONP (Structural Classification Of Natural Products) tool arranges the scaffolds of the natural products in a star or tree-like representation. SCONP can be used as analysis tool or hypothesis-generating tool for charting of the chemical space explored by nature in the context of natural product inspired compound library design and development for chemical biology and medicinal chemistry research. Similar kind of charting can be used to explore the patented drug space to provide guidelines for future drug discovery research.
Focus+Context
I would like to bring your attention on “Focus+Context” methods. A family of methods such as fisheye view, document lens, perspective wall which allows user to focus on a special item, while preserving the broader context around it, all in a single display.
In a “focus+context” view a subset of the data can be viewed at a higher resolution with the remaining contextual data still being in view, and it useful when data sets are too large to visualize on one screen.
In general, fisheye approach employs a non-euclidean geometry such as hyperbolic space. In hyperbolic space circumference and area increase exponentially instead of geometrically, which enables allocation of more space for zoomed visualization.
Radial Clustergrams
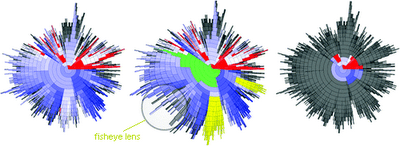
Radial clustergram is an intuitive radial space-filling method for visualizing cluster hierarchies. Radial clustergram arranges the clusters into a series of layers, each representing a different level (depth) of the tree, and it can display both unpruned and pruned trees. Parent−child relationships are represented as adjacency of nodes. Further each layer is segmented for child nodes, where each segment can be color-coded based on user-defined property. A fisheye distortion view can be used to focus on areas of interest, without losing sight of the broader context around it. Radial clustergram is implemented using Shemanarev’s Anti-Grain Geometry (AGG) library in .Net environment. Radial clustergrams have been used to visualize diversity of chemical libraries and conformational space of small organic molecules.
ModelBrowser
ModelBrowser is interactive visualization system for biosimulation. ModelBrowser allows researcher to ask questions about a model through interaction with a graph of the mathematical model, particularly to understand and modify others’ code and debug their own. Model variables and equations appear as a directed graph of nodes and edges. Parameters (such as rate constants) and variables can be color-coded by scientific unit and clustered by module or hierarchies (see below).
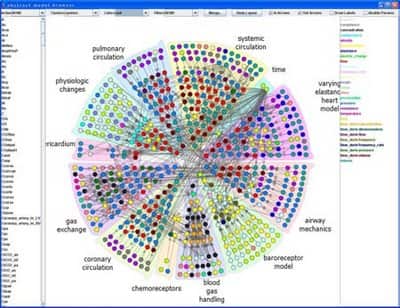
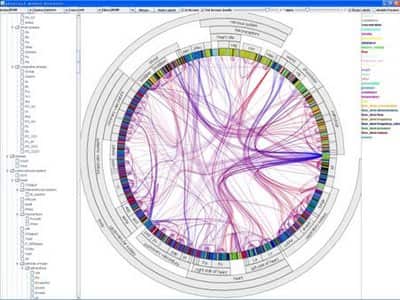
ModelBrowser runs as a plugin to JSim, a Java-based simulation environment developed at NCR Washington. ModelBrowser can search, filter, color, cluster, or merge variables based on metadata associated with the model. During navigation model visualization can be expanded or contracted based on hierarchies or modules (see next image, fully expanded model). ModelBrowser approach to model visualization is different from other circular visualization as visualization depends on model metadata and ontologies.
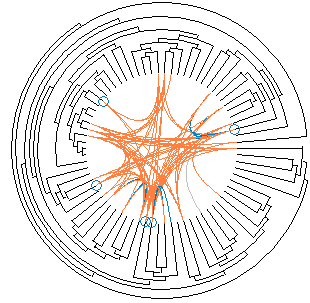
TreeDyn
TreeDyn is a powerful tool for editing and analyzing multiple trees. It makes extensive use of meta-information (or annotations) related to the entities under study such as taxonomic descriptions, geographic distribution or gene functions by using external annotation files in the form of key-values couples. These relationships are used by dynamic graphics operators, information visualization methods like projection, localization, labelization, reflection allowing an interaction from annotations to trees, from trees to annotations and from trees to trees through annotations.
TreeDyn is designed to use a standard 2D Euclidean space with feasibility for alternate layouts such as radial view, circular inside and outside.